

The AI Disruption Report
Plans for AI-driven disruption appeared in 9% of Qualitate’s discussions with enterprise software buyers in 1H ’26. Six months earlier, it appeared in just 3%.
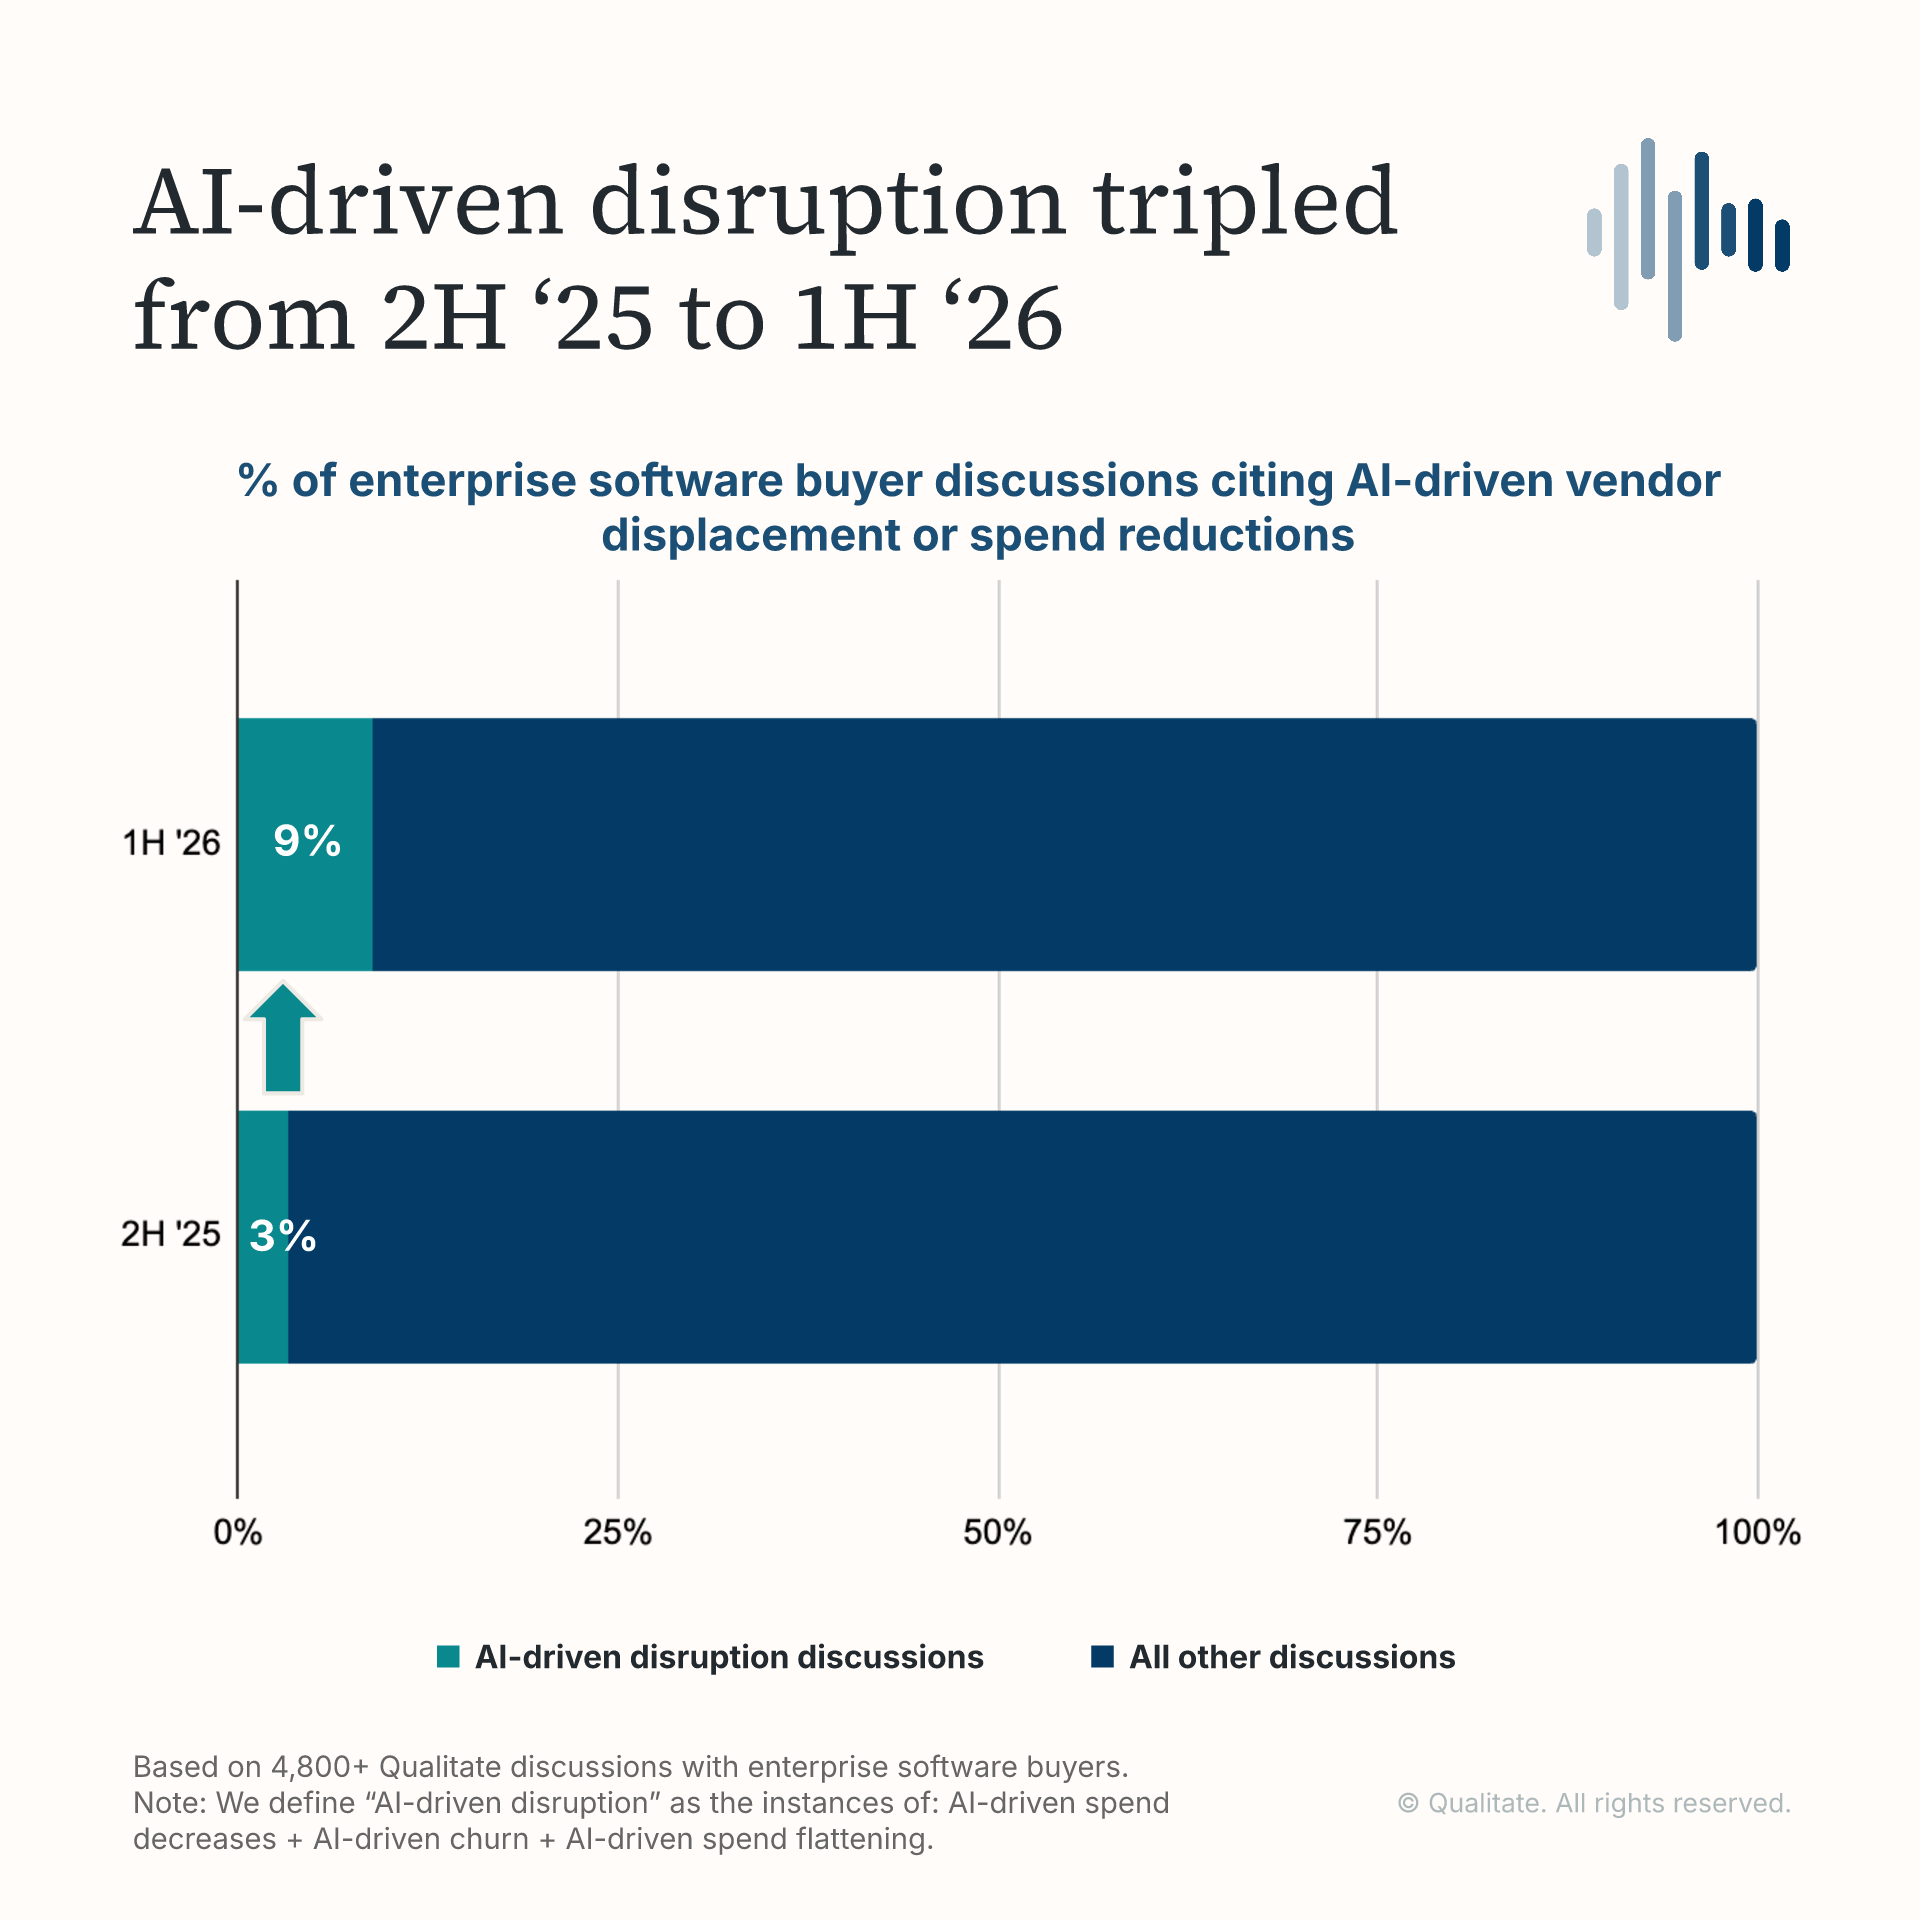
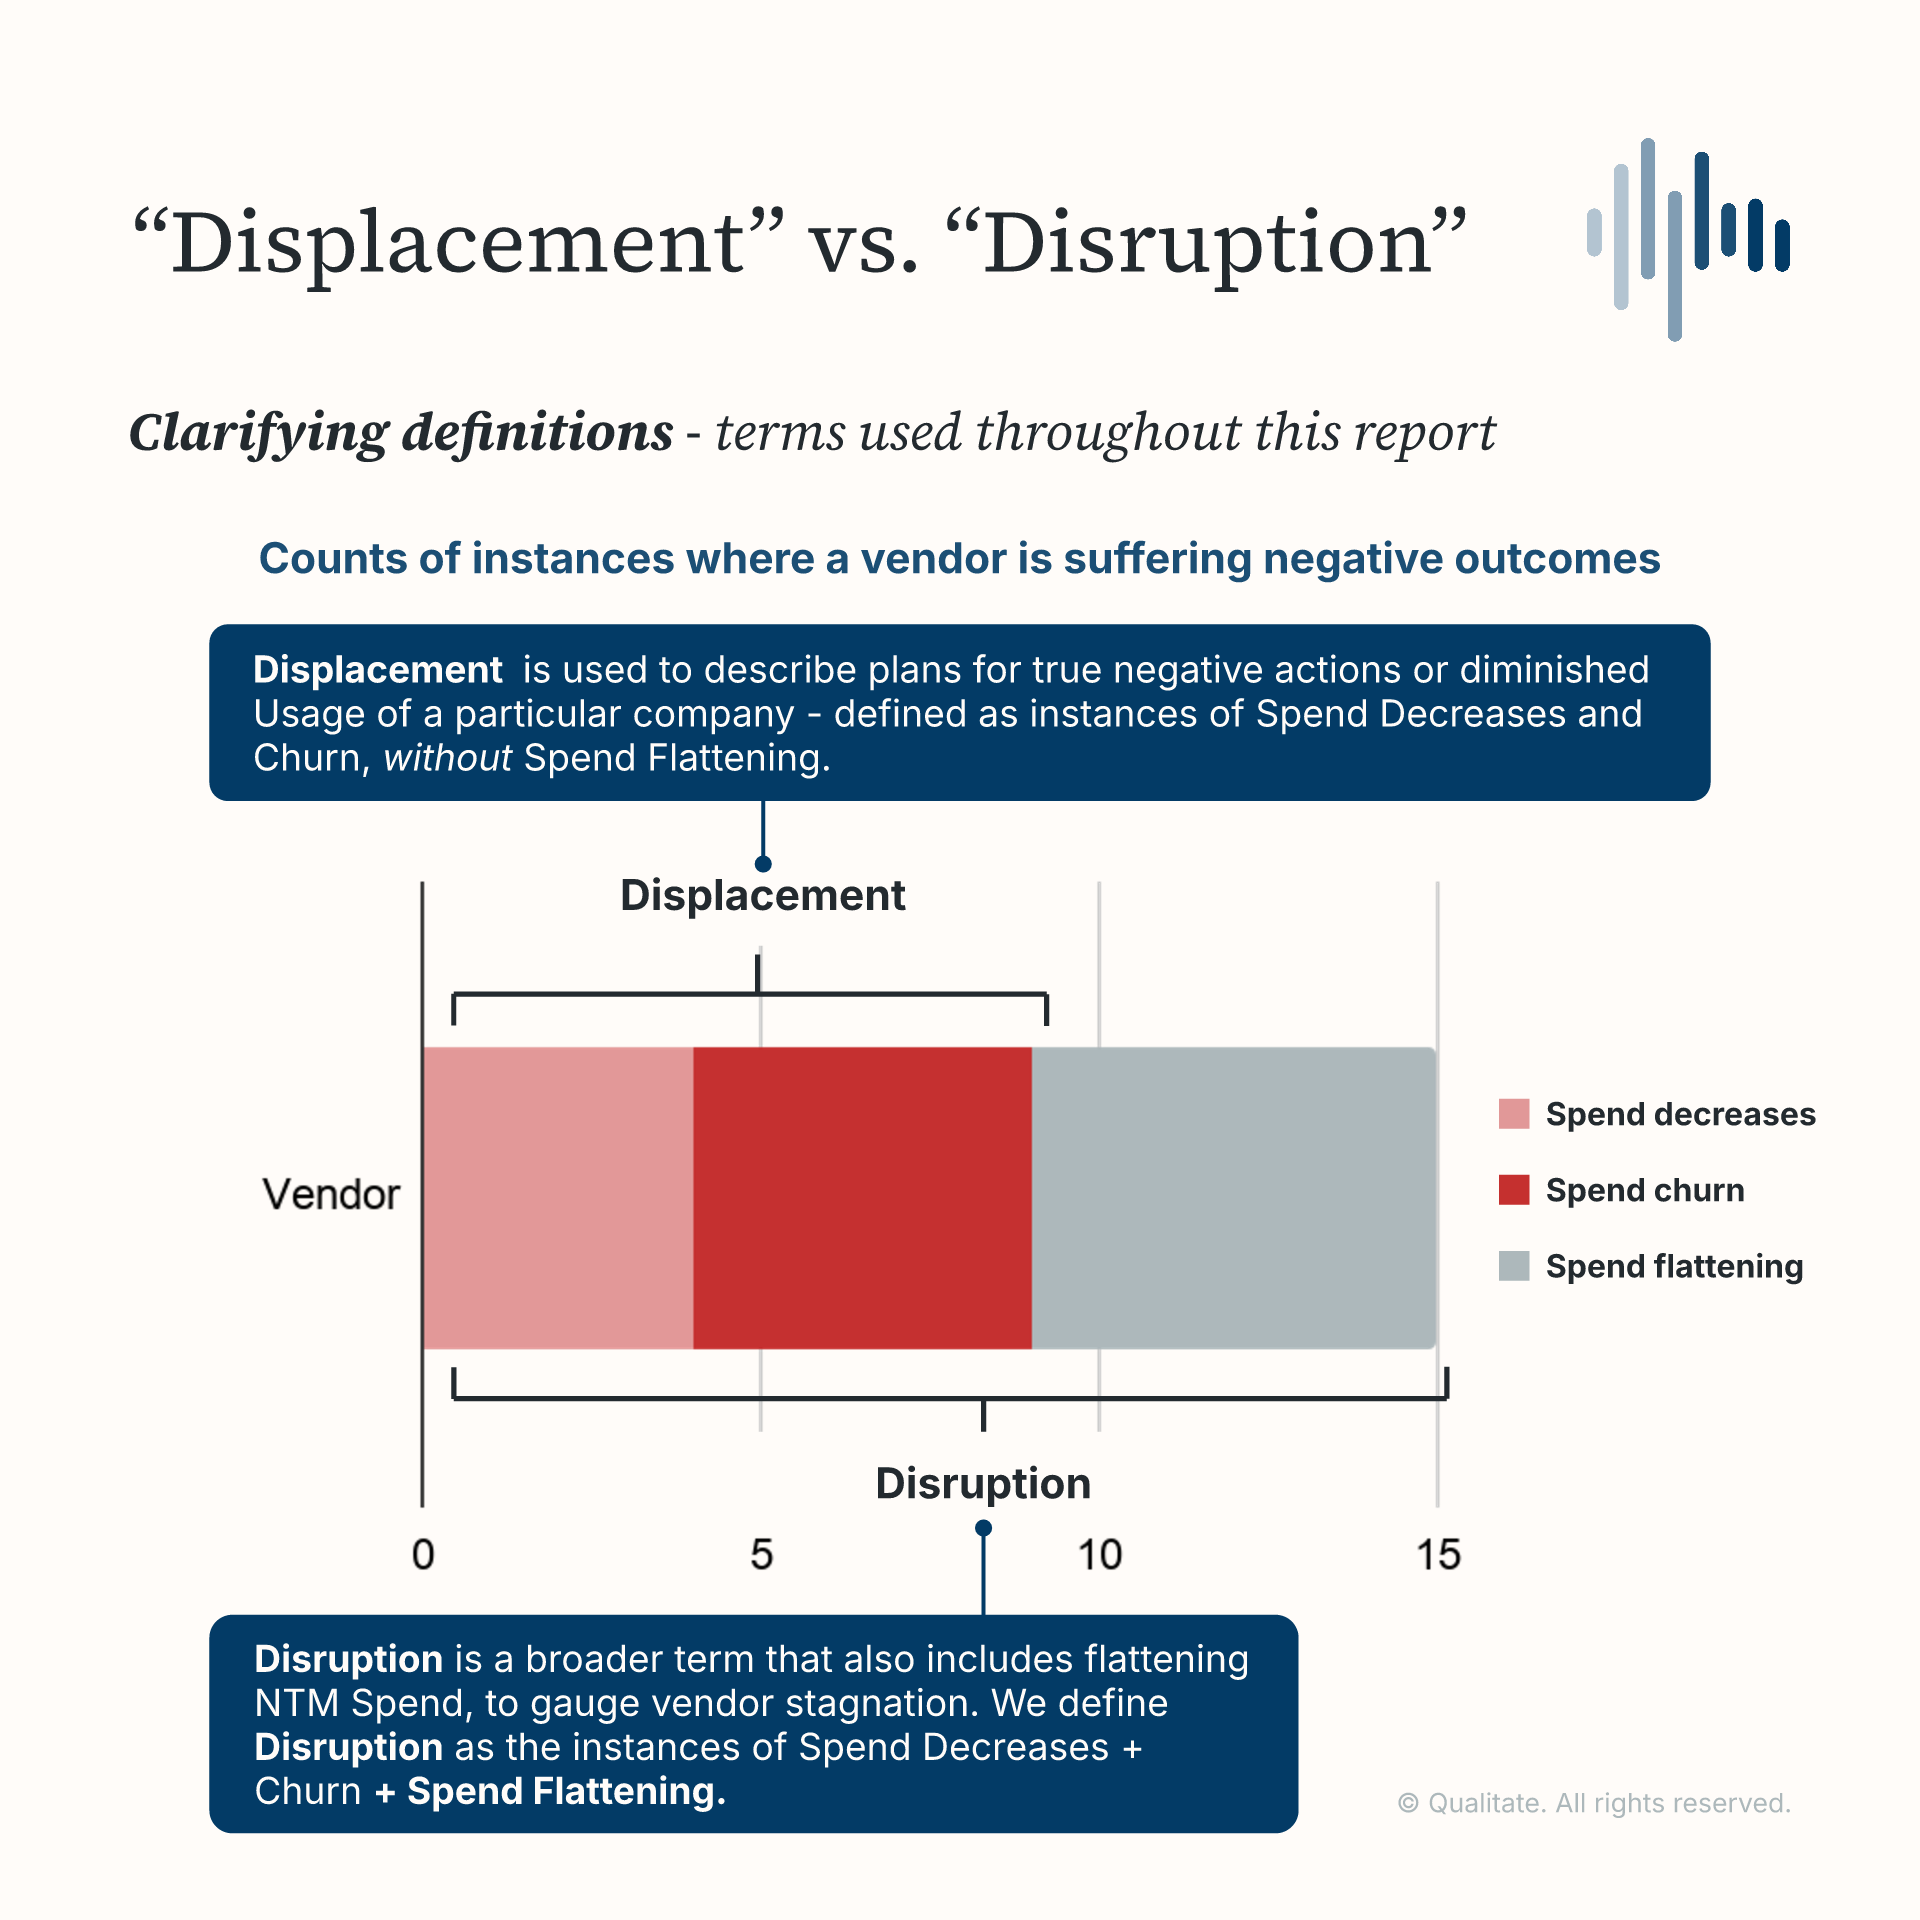
Note: AI-driven disruption refers to buyers indicating plans to decrease spend, flatten spend, or churn from a vendor due to AI. Based on 4,800+ senior tech buyer discussions across studies.
Buyers are cutting back before they remove vendors: AI is driving a larger portion of next-twelve-month spend decreases than it is of planned replacements (churn).
Below we break down:
- How much is AI driving spend decreases and churn?
- Where do AI-driven displacements show up most?
- Which vendors are the most impacted?
- Who is seeing flattening spend due to AI?
- In these AI disruptions, who is winning?
Download the full report for more than 50 pages of charts and vendor-level analysis.
How much is AI driving spend decreases and churn?
AI now drives 27% of planned vendor spend decreases, up about 10 percentage points from our last study.
The most common pattern is adoption of a frontier model and scaling back current spend on incumbent tools.
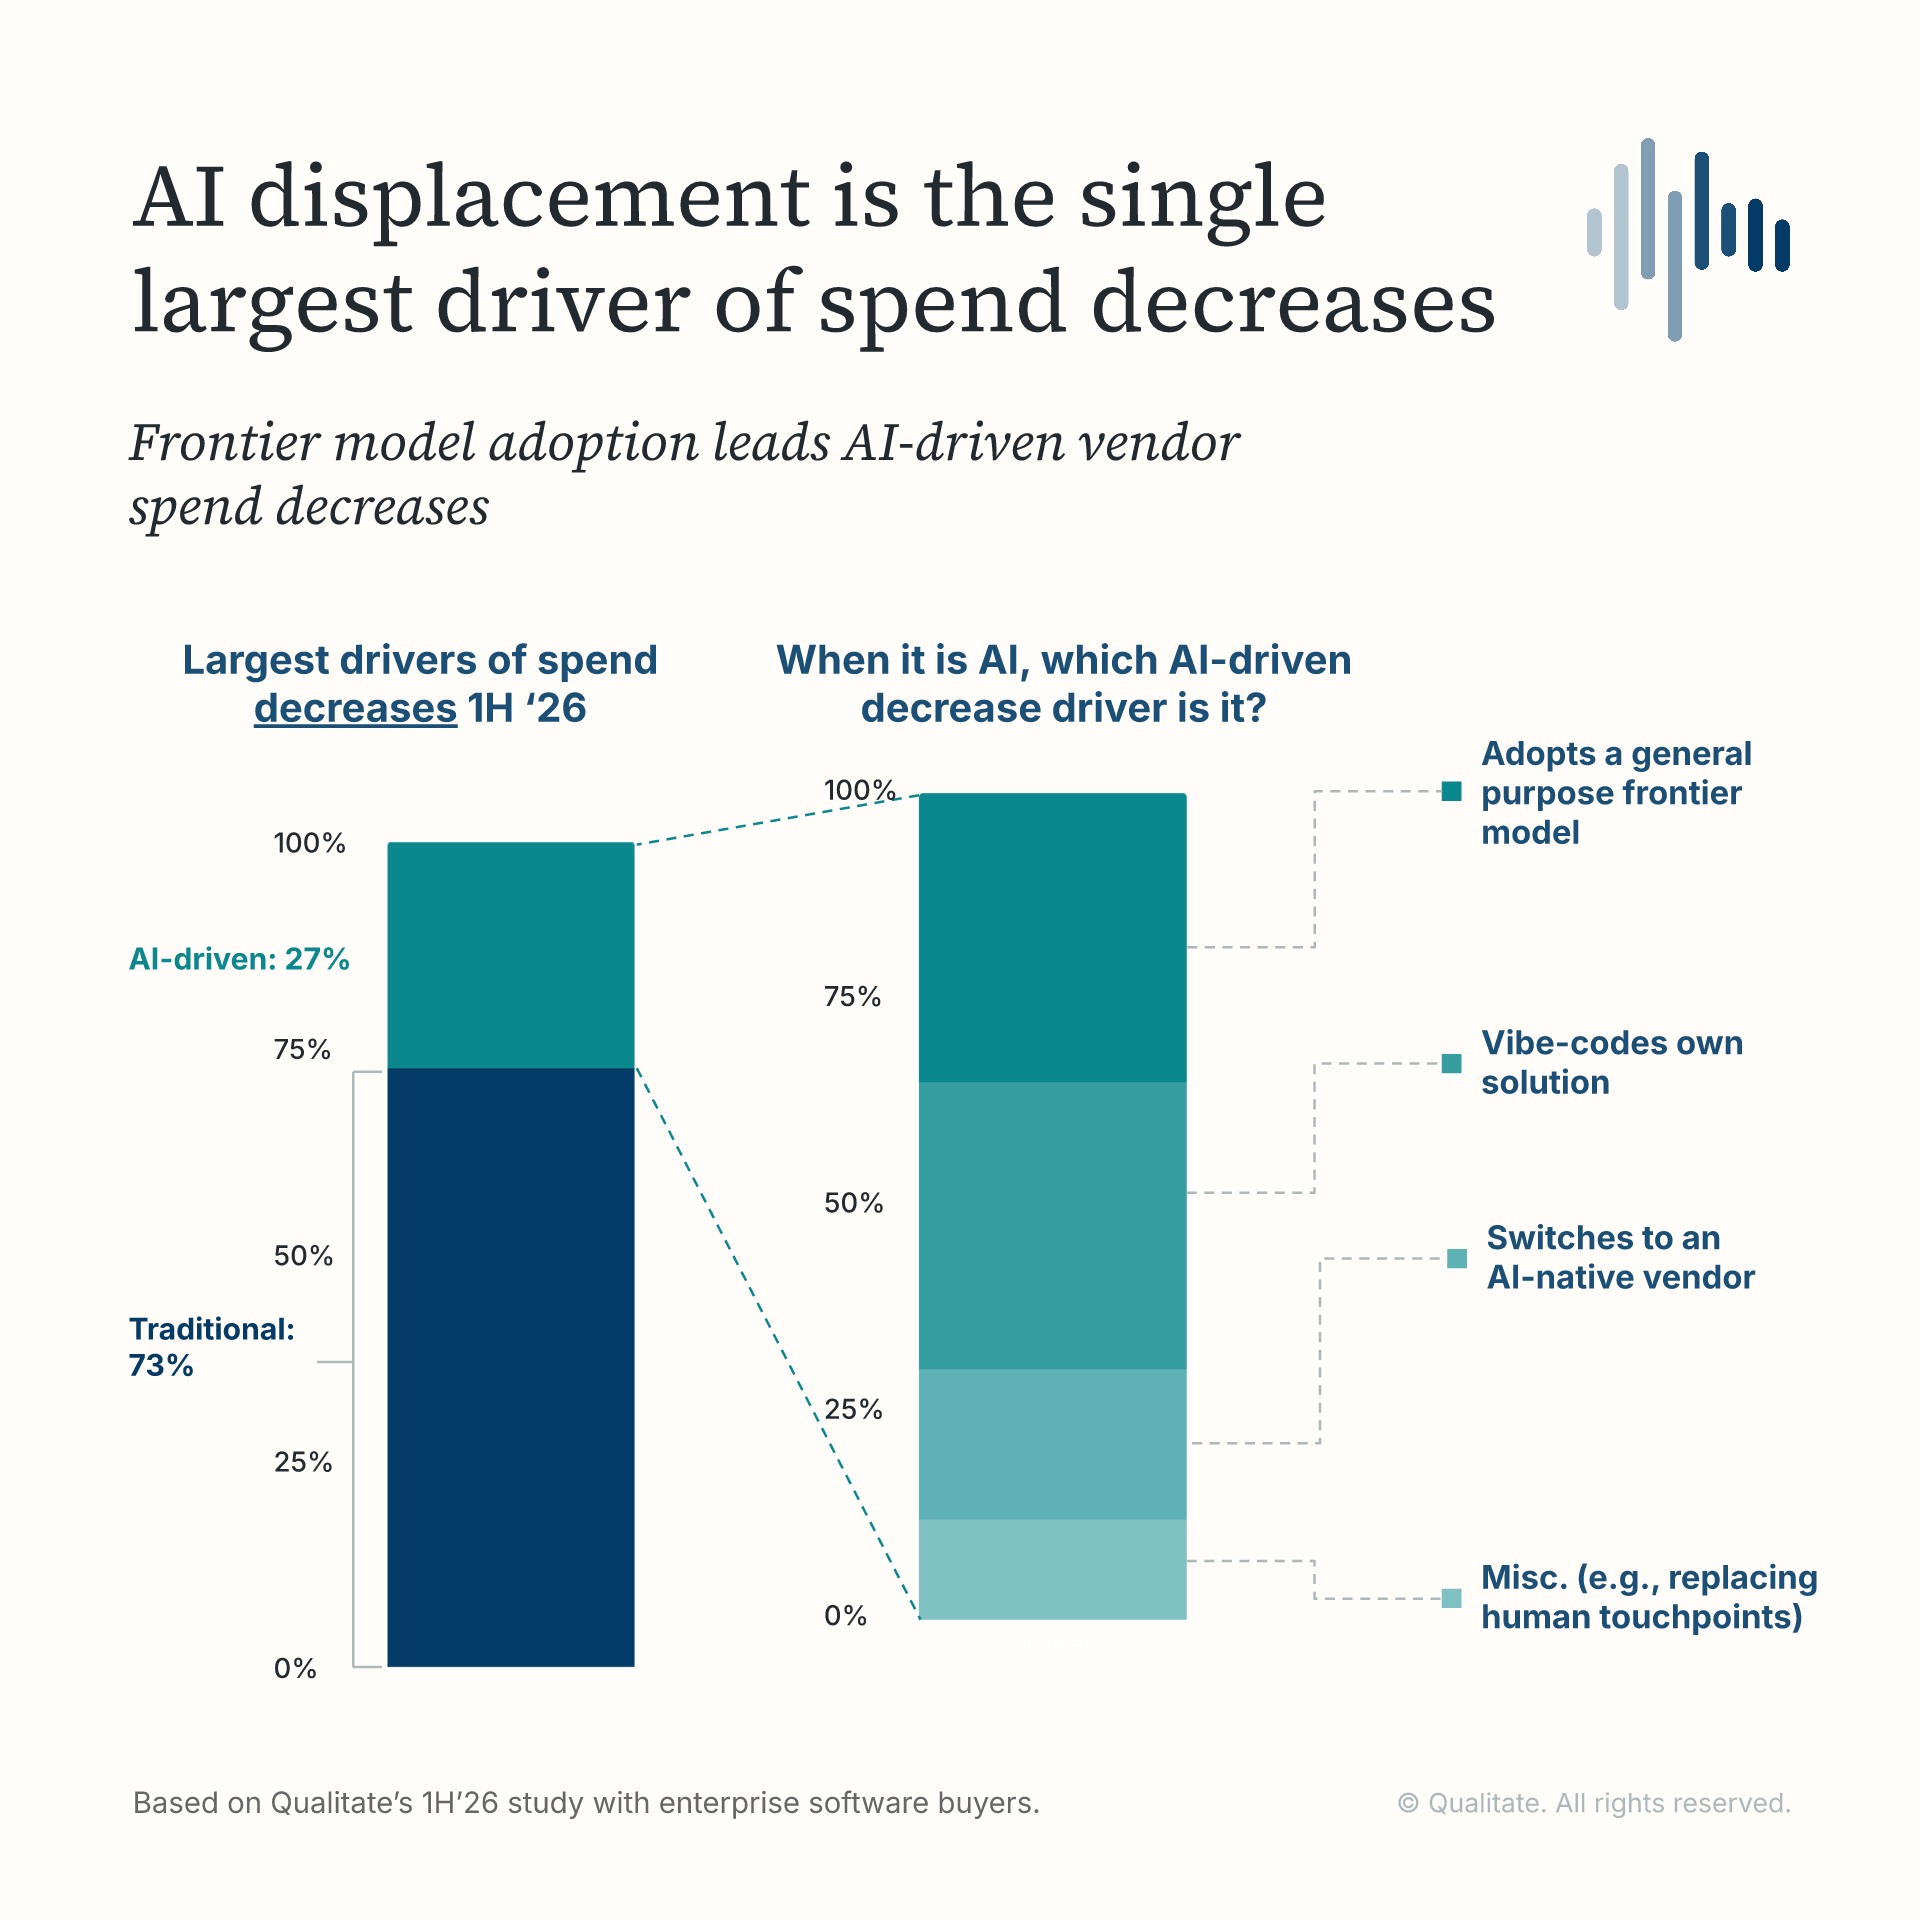
Meanwhile, AI drove 18% of planned churn in 1H ‘26, which is also up about 10 percentage points. The most common reason is that organizations are vibe-coding their own tools instead of renewing an existing product.
Overall, spend decreases remain more common than churn because buyers often trim a tool’s budget before removing it.
Frontier model pressure on vendor spend
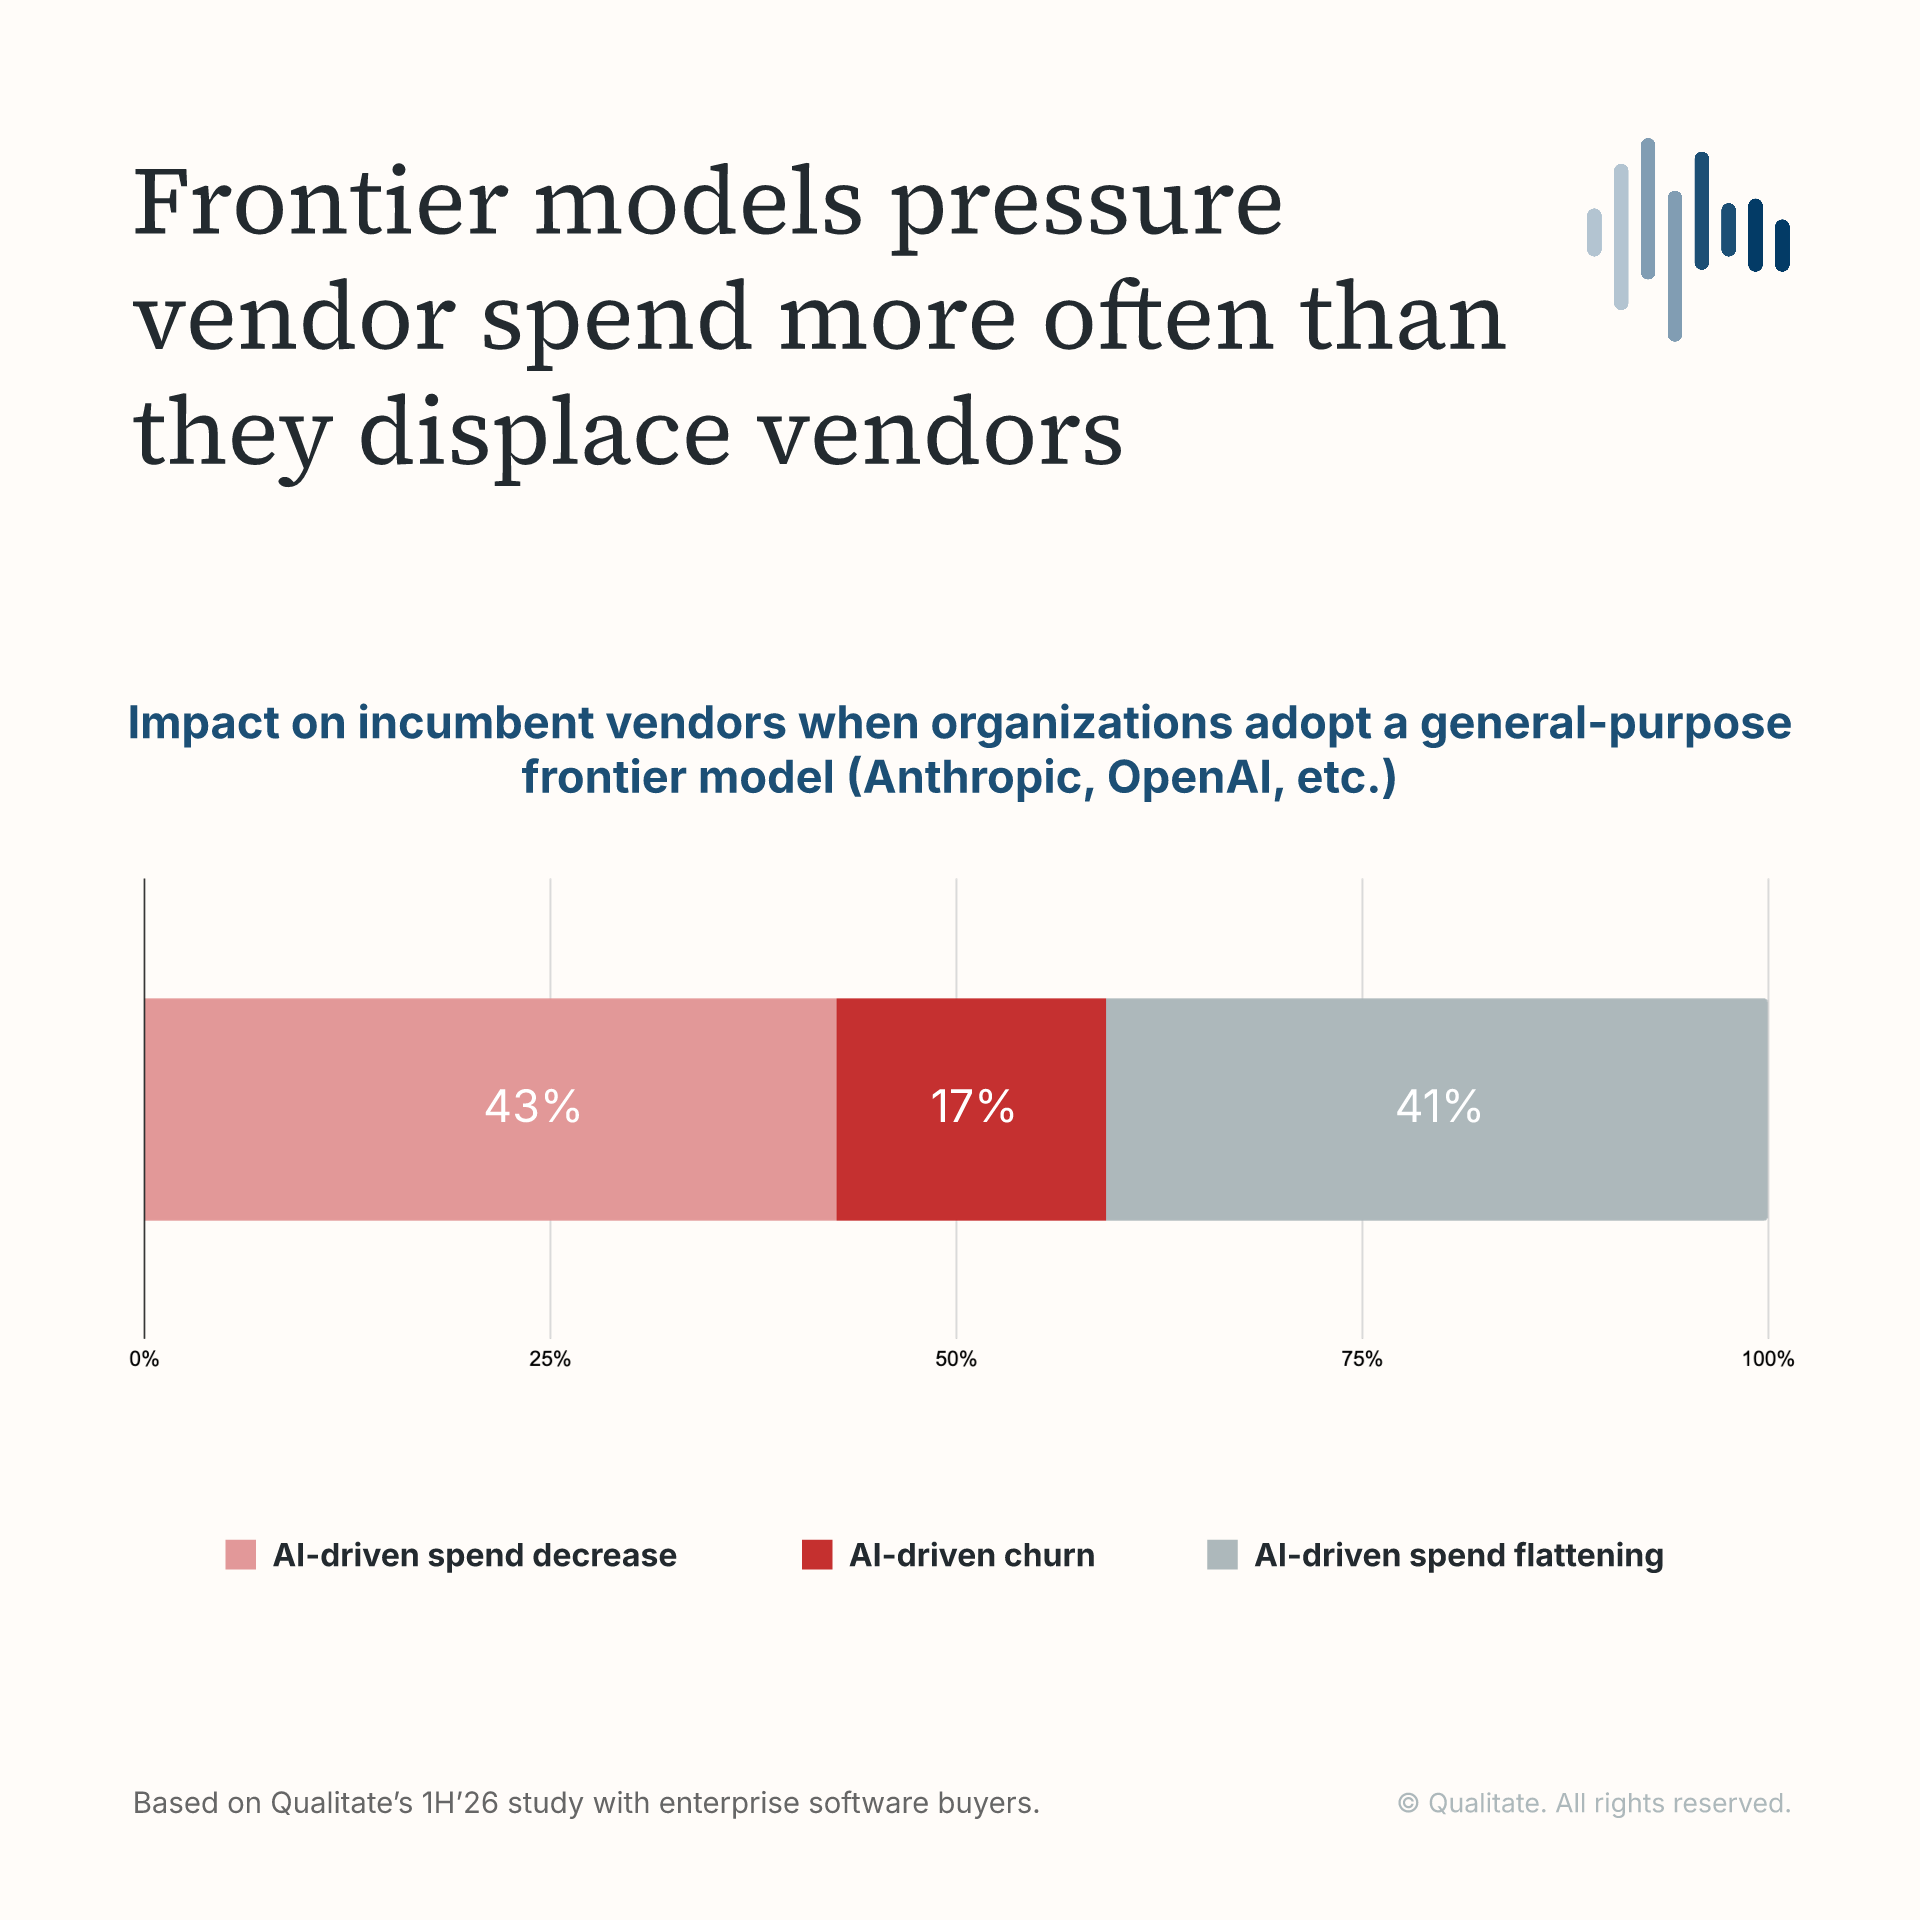
When organizations adopt frontier models, incumbent vendors usually see lowered or flattened spend.
Spend decreases account for 43% of outcomes and flattened budgets for 41%, while only 17% end in churn.
Buyers often use Claude or ChatGPT to handle part of a job without replacing the incumbent vendor.
Where do AI-driven displacements show up most?
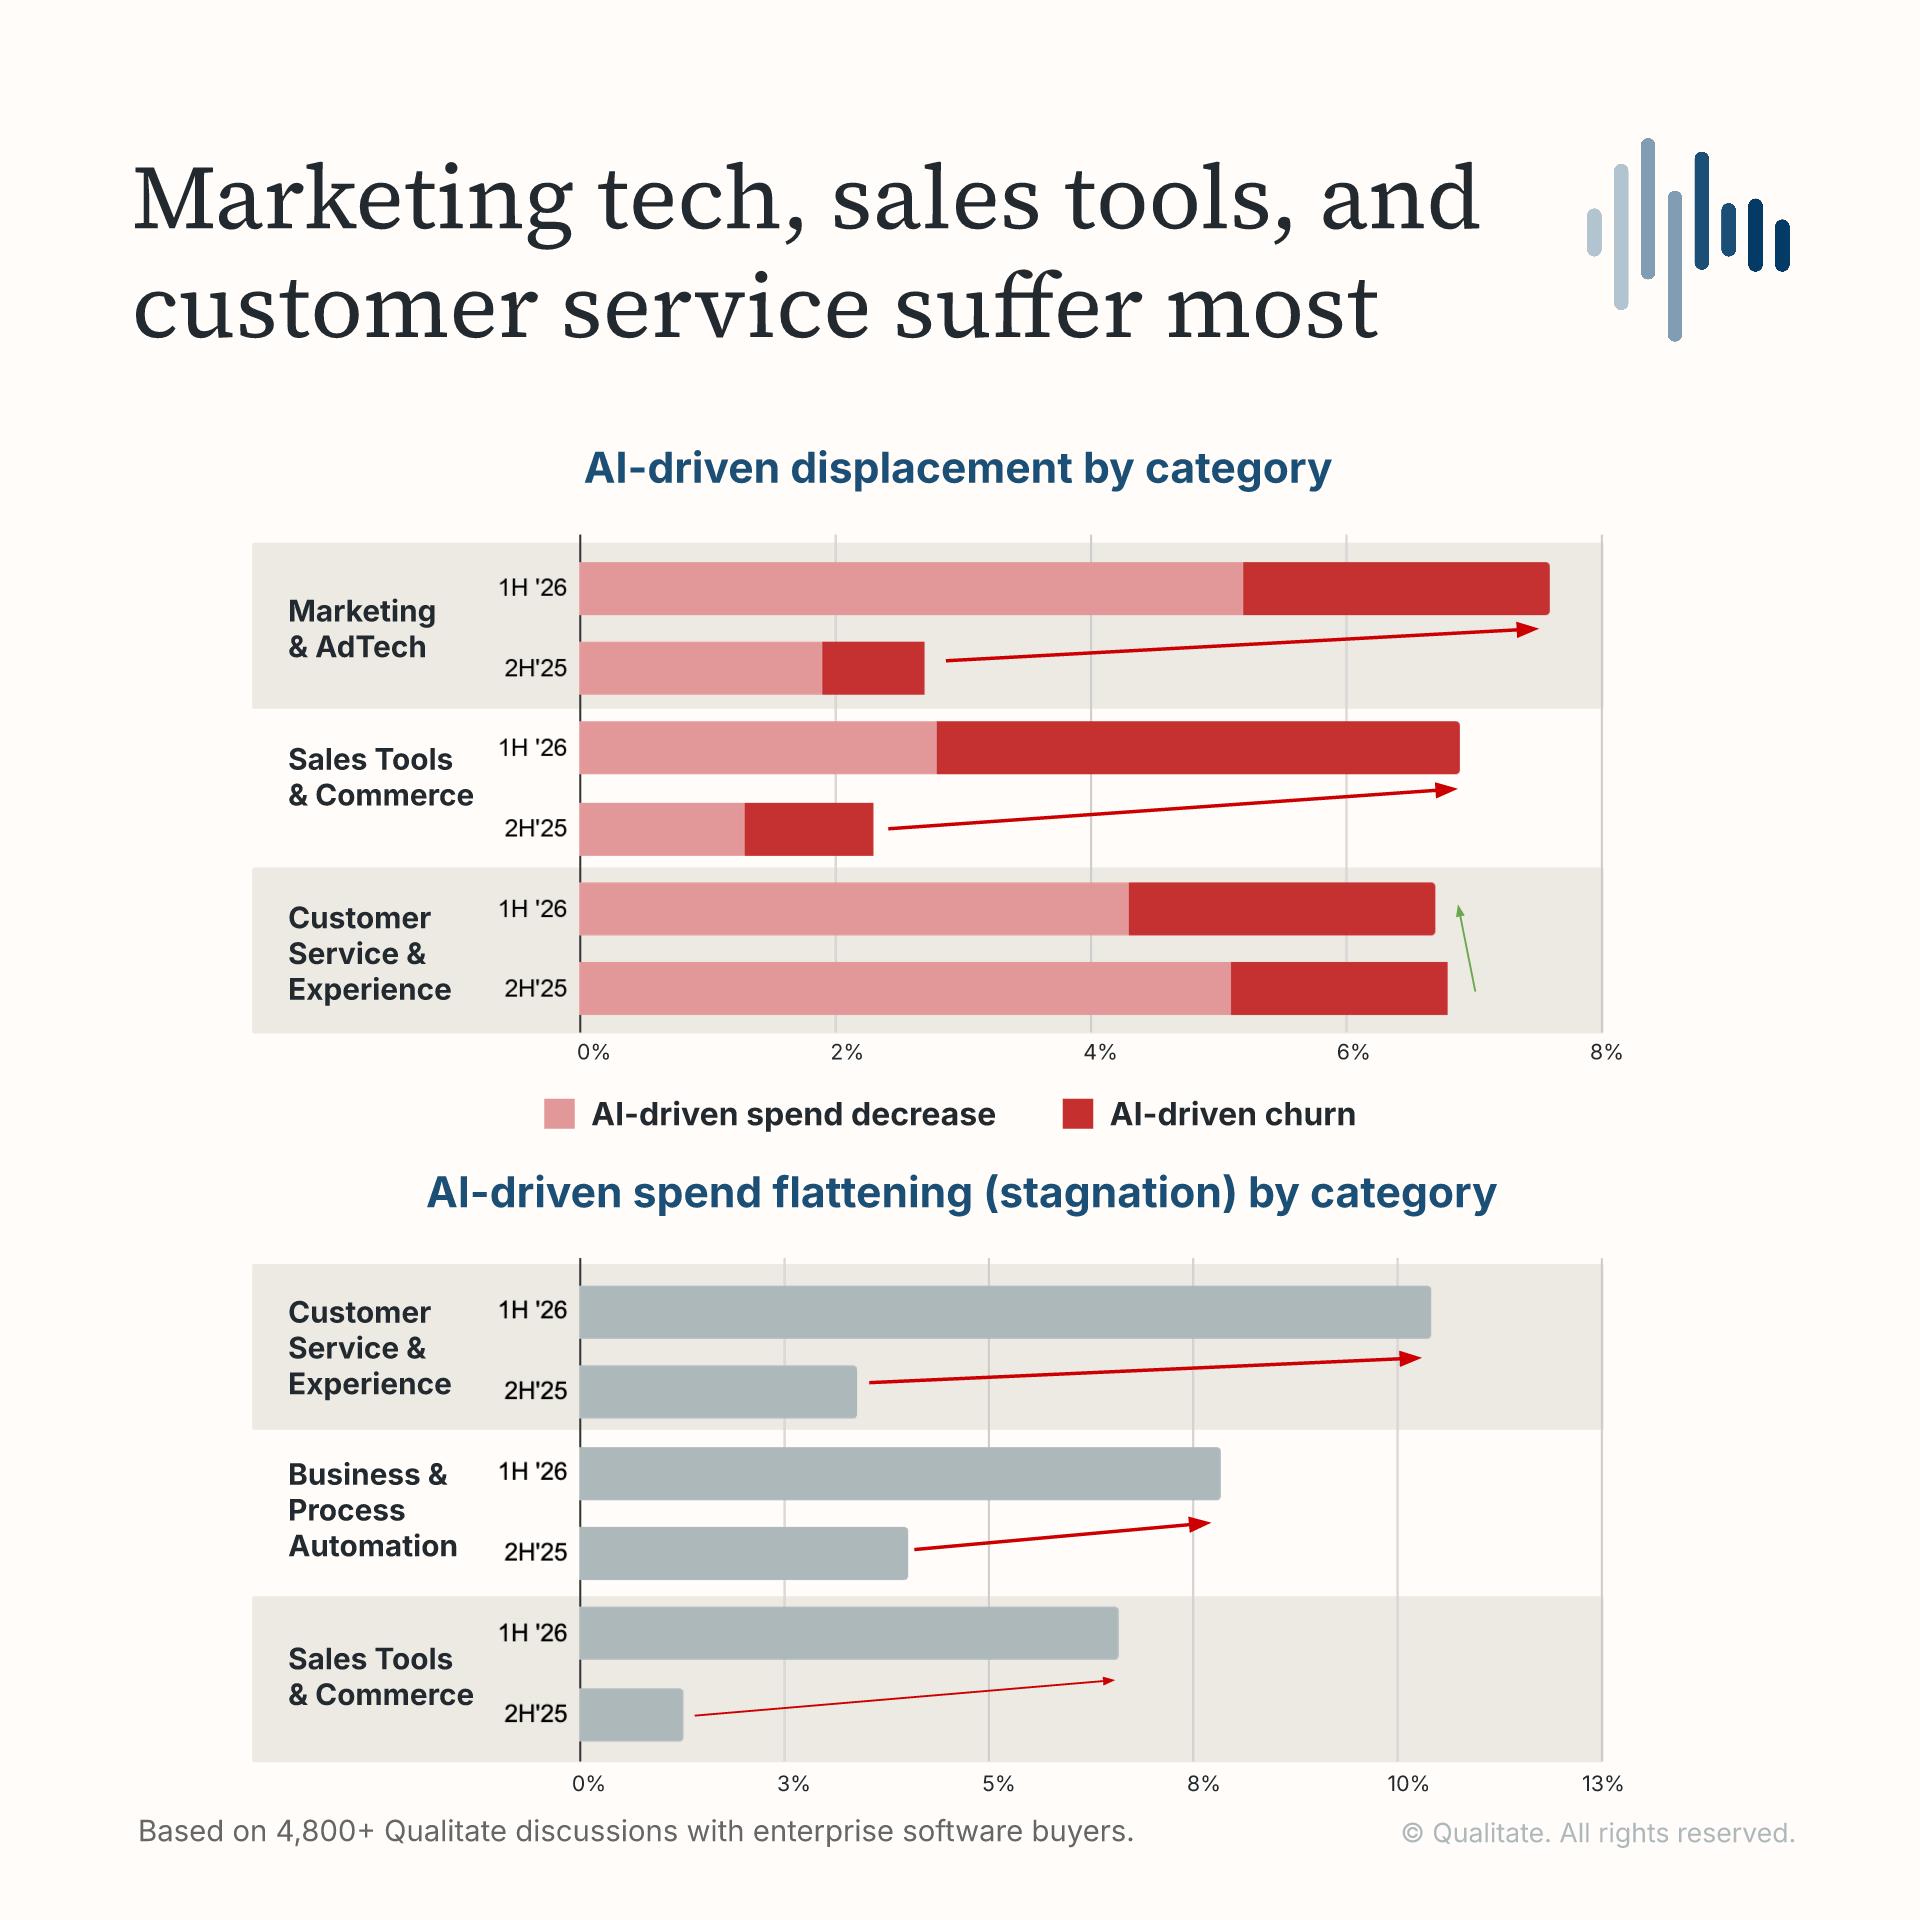
At the category level, marketing & adtech and sales tools & commerce posted the largest increases in AI-driven displacement between 2H ’25 and 1H ’26.
Meanwhile, customer service posted the largest increase in flat spending tied to AI.
Download the report for the full analysis.
Which vendors are the most impacted?
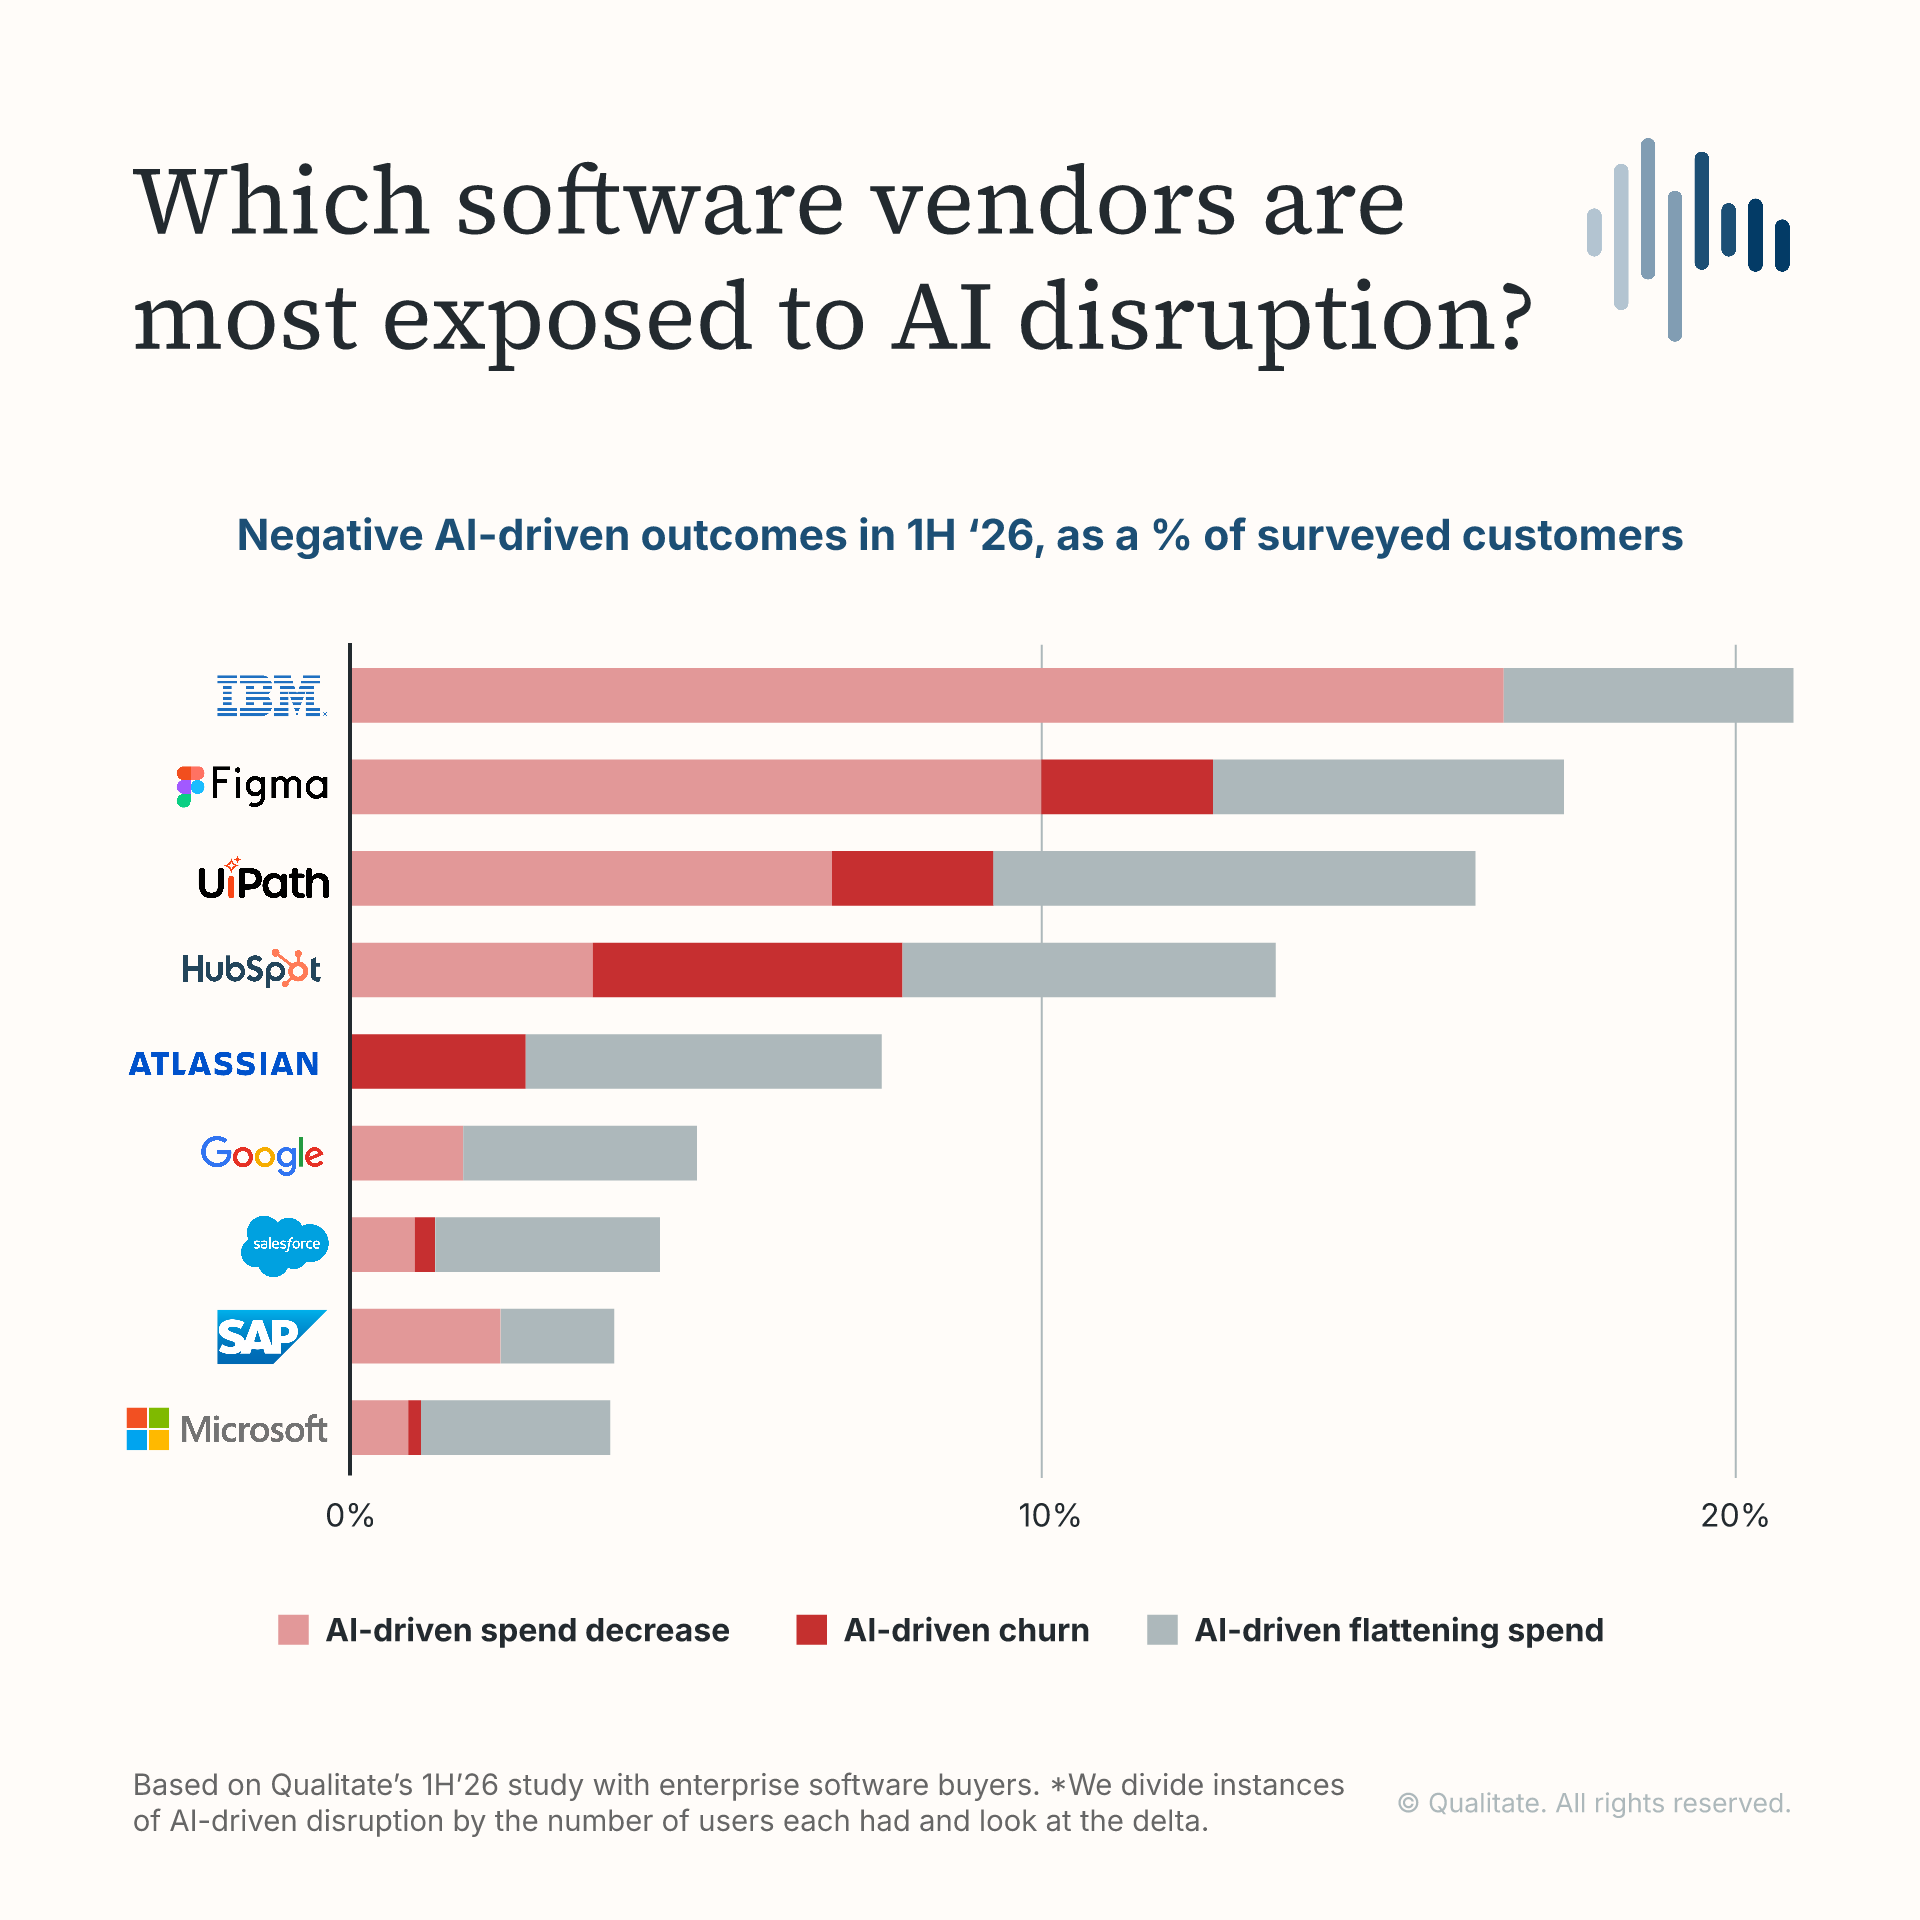
HubSpot recorded the most AI-driven displacement in the peer set.
“I rebuilt my pipeline directly from Snowflake data on Claude, and I found that UI to be more useful than HubSpot. In the future, we plan to decrease spend as we move towards more custom tooling.” – Head of Partnerships, Financial Services & Insurance, Small Business, Netherlands
Figma and UiPath also suffer frequent AI-driven displacement
“I think AI is going to basically eat the lunch of a lot of these pre-existing, established tools like Figma…I know Claude has built-in design skills and features and capabilities. Our need for wireframing is not that robust.” –
Download the full report for a breakdown by vendor.
Who is seeing flattening spend due to AI?
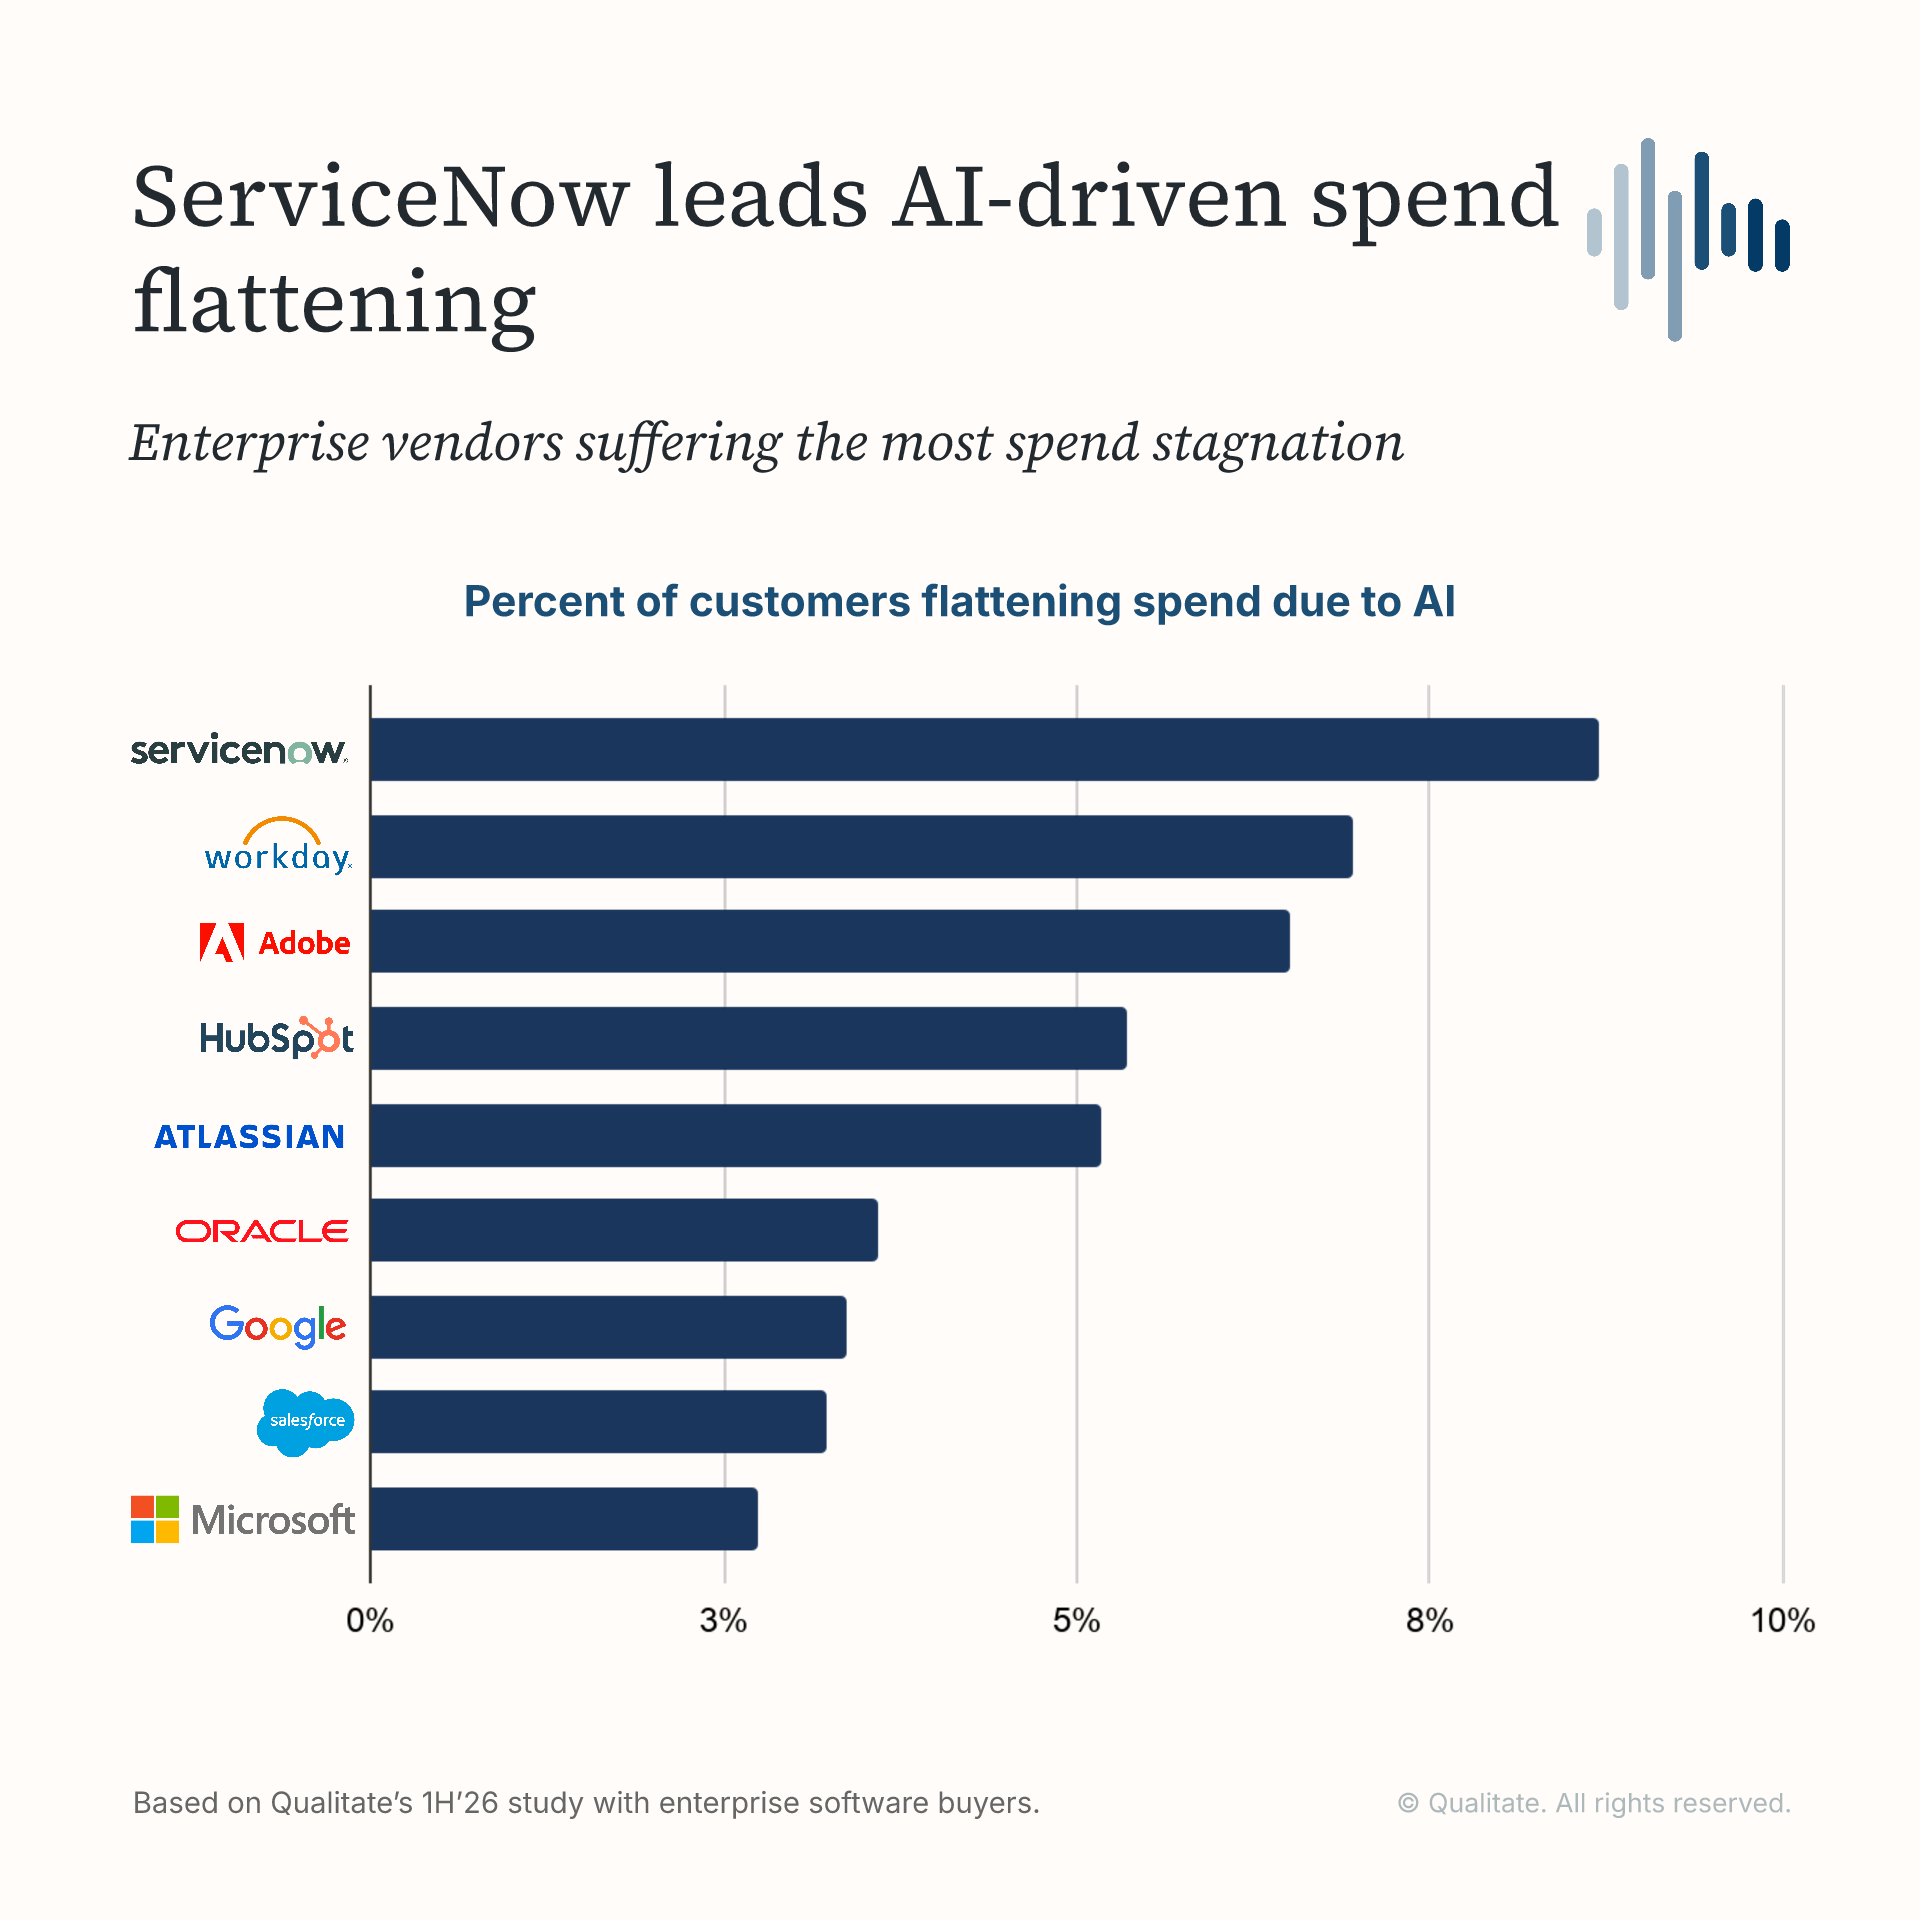
After adjusting for usage in the study, ServiceNow, Workday, Adobe, and HubSpot recorded the most AI-driven spend stagnation. Buyers are holding their budgets flat while they test how much work AI can absorb.
This may be the stage before displacement. Buyers have paused new spending without removing systems that sit deep in the enterprise stack.
ServiceNow stands out because nearly all of its AI-related pressure comes from flattened budgets rather than displacement.
In these disruptions, who is winning?
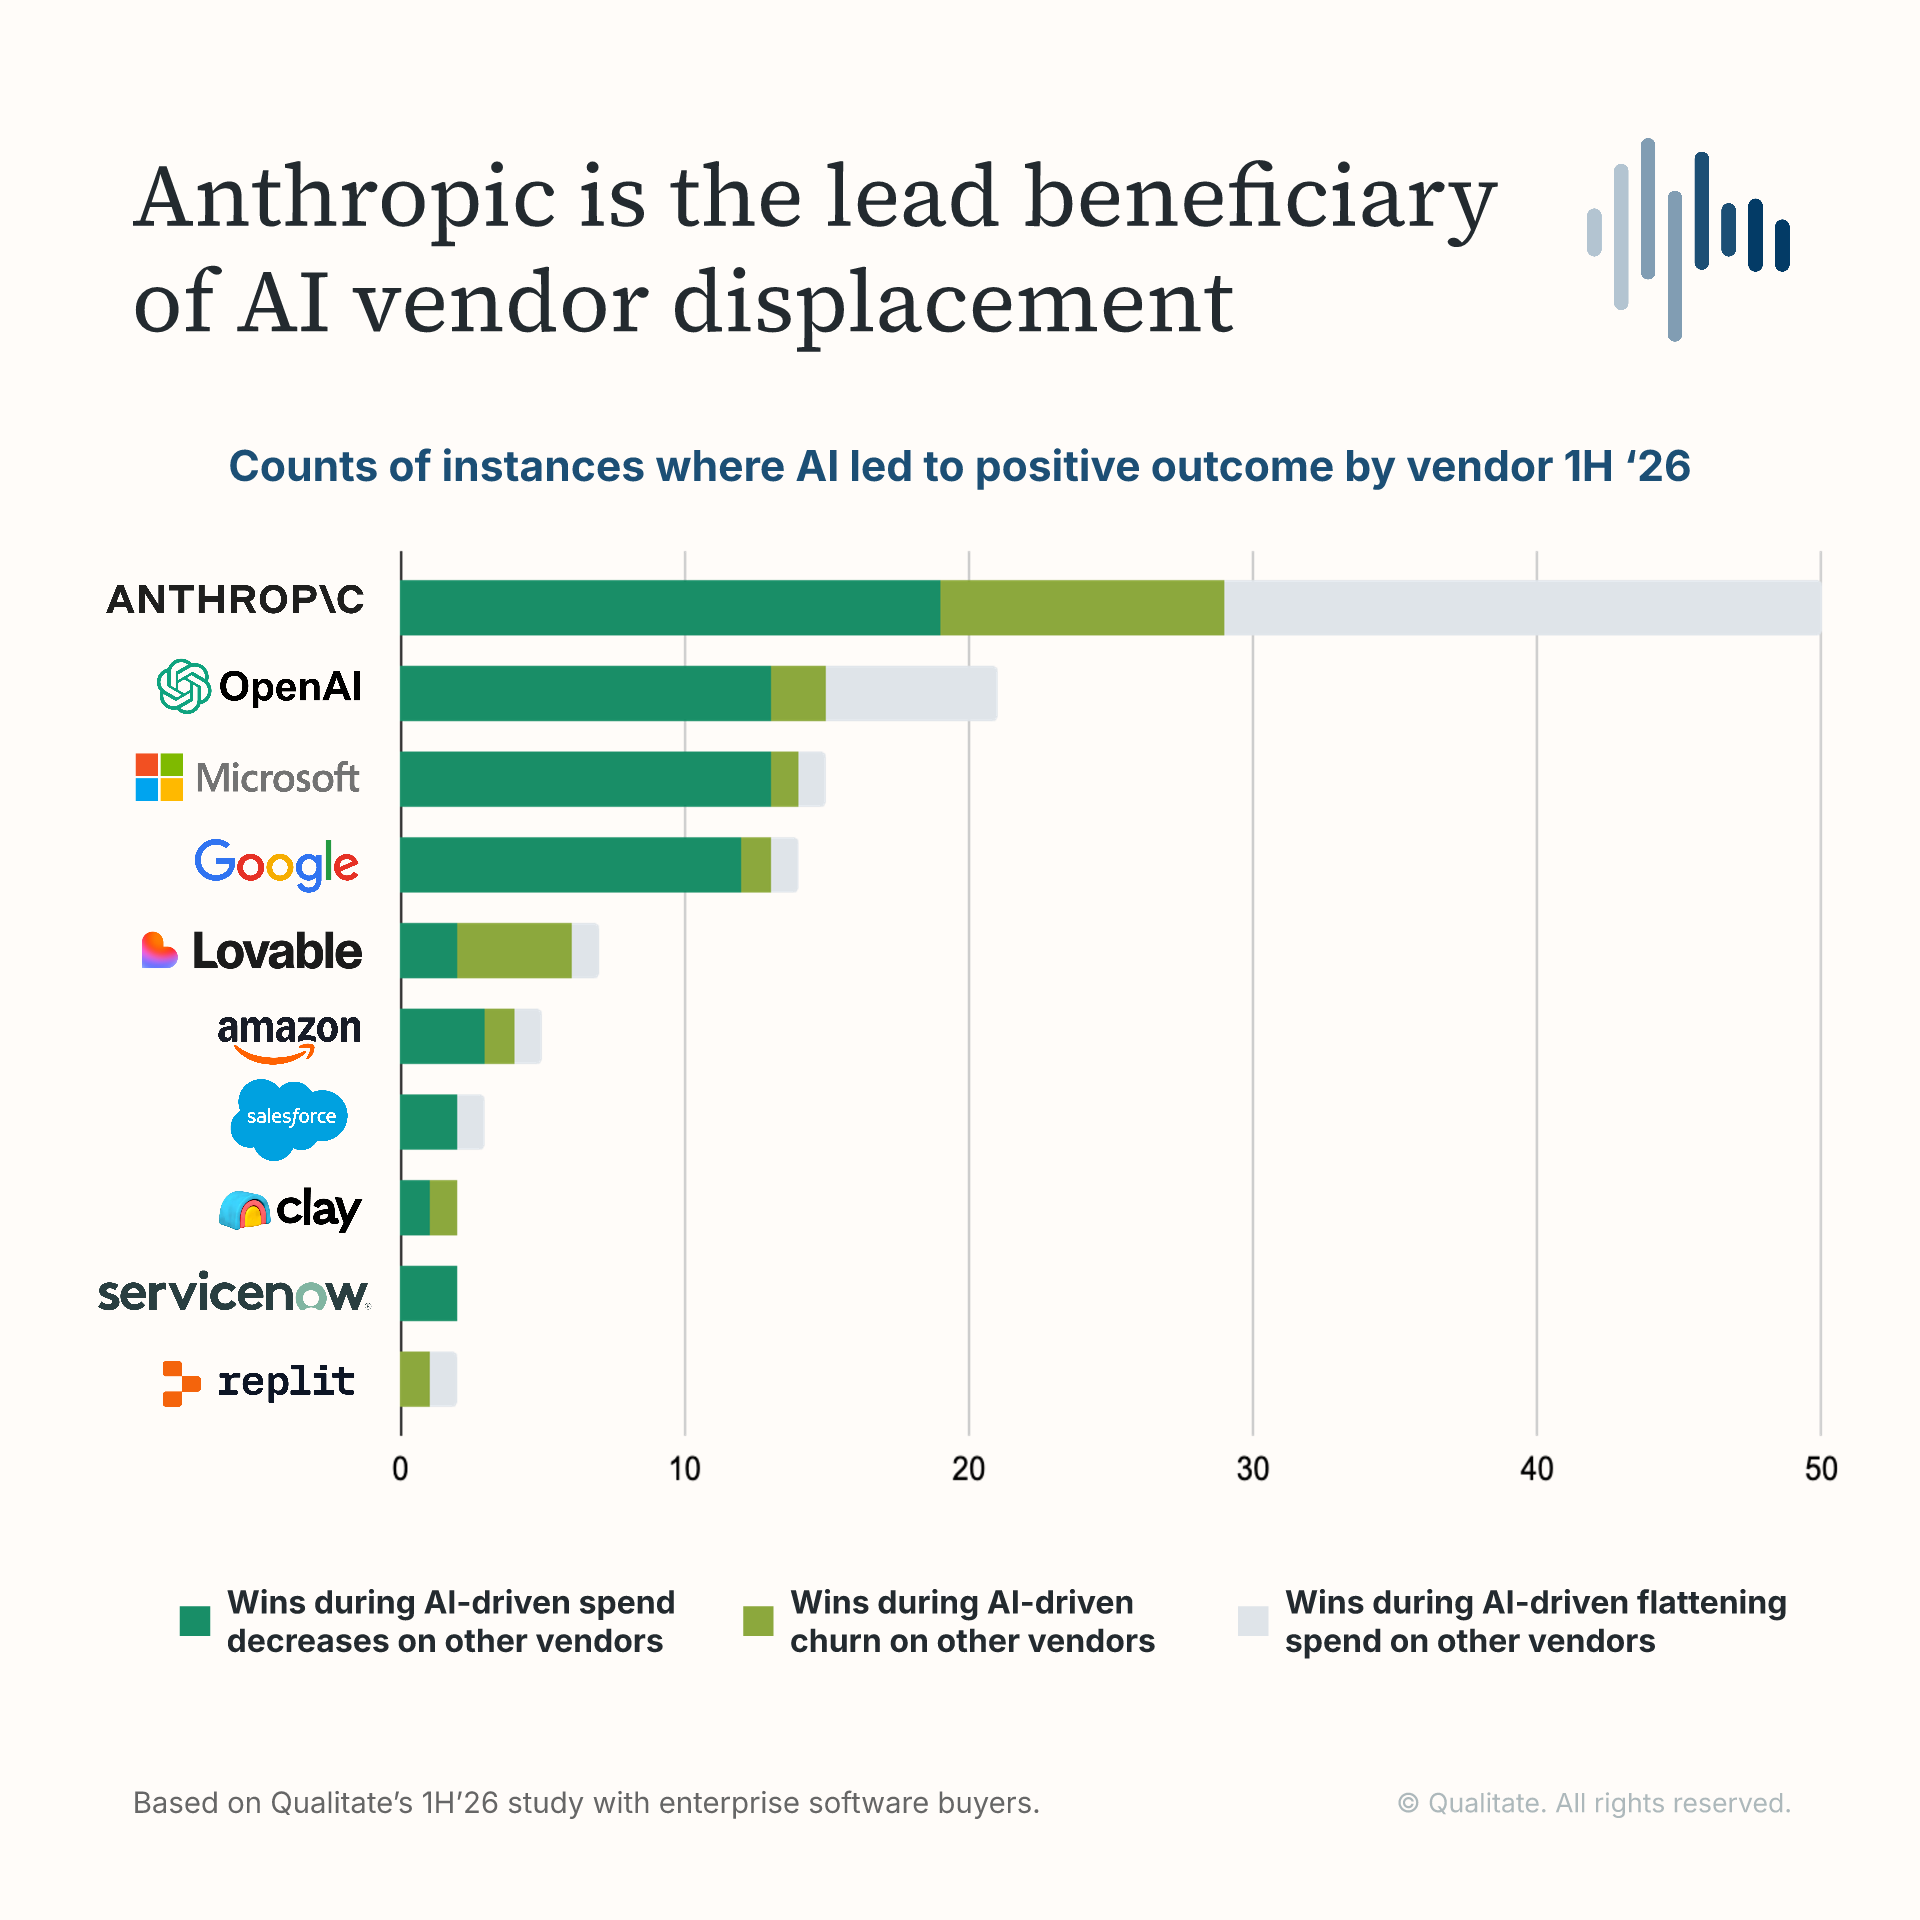
Anthropic is the most frequent beneficiary, followed by OpenAI. Microsoft and Google form the next tier.
Download the full report to see the complete list.
Methodology
This analysis compares Qualitate’s 1H ’26 and 2H ’25 Enterprise Applications studies with senior enterprise software buyers.
We count an AI-driven disruption when a buyer links AI to lower or flat spending with a vendor, or to planned churn. Vendor-level rates are adjusted for the number of surveyed customers using each product.
The full report includes more than 50 pages of charts and vendor-level analysis. Use the form on the right to download it.
FAQ
What is Qualitate?
Qualitate delivers expert intelligence for every investment and strategy decision. Our AI Moderator powers the full primary research workflow, from study design and expert recruitment to interview moderation and insight creation. See how 25 buyer conversations get done in 3 days.
How does Qualitate create its research?
Qualitate conducts studies across industries on a regular cadence, proactively interviewing technology buyers and experts using our AI Moderator about their forward-looking purchasing plans. The platform quantifies the outputs so they sit on comparable time series across 10K+ companies and markets. Full reports, data, and transcripts live on the Qualitate platform.
How is this different from a survey or expert network call?
Traditional surveys capture checkbox responses. Expert network calls give depth but at limited interviews per project they’re not statistically meaningful. Qualitate runs thousands of discussions per study, structured consistently, so the output is both deep and quantifiable.
Who are the buyers in these discussions?
Verified senior technology buyers - directors, VPs, and C-suite executives actively managing purchasing decisions at enterprise organizations. Qualitate screens for seniority, active buying authority, and relevance to the specific market being studied. Learn more about joining our panel.
Subscribe to the Qualitate newsletter
.jpg)
.png)